resource
Nov. 1 2011
Resource
Temperature Deviation by Latitudes (Keeping Track)
Description
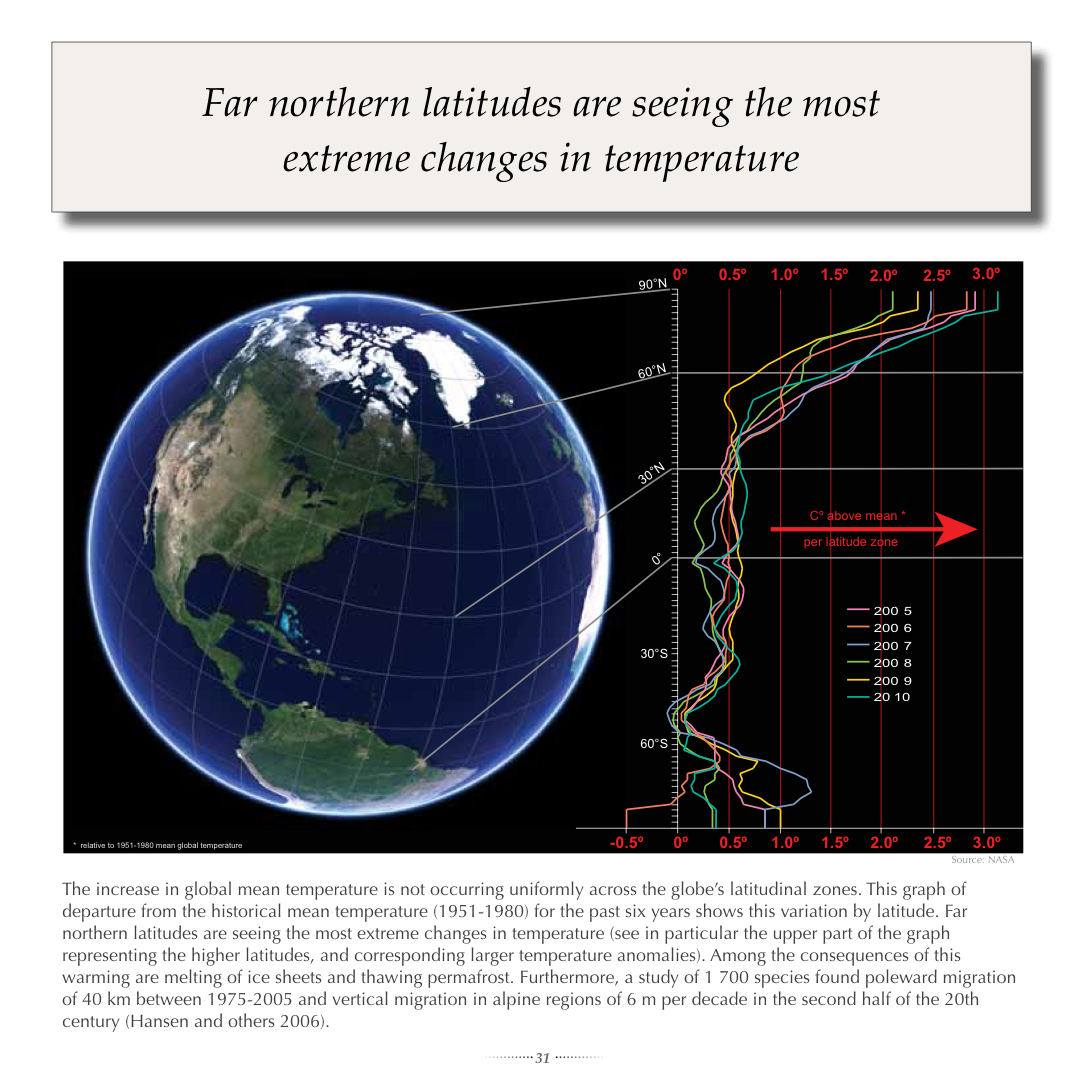
Far northern latitudes are seeing the most extreme changes in temperatureThe increase in global mean temperature is not occurring uniformly across the globe’s latitudinal zones. This graph of departure from the historical mean temperature (1951-1980) for the past six years shows this variation by latitude. Far northern latitudes are seeing the most extreme changes in temperature (see in particular the upper part of the graph representing the higher latitudes, and corresponding larger temperature anomalies). Among the consequences of this warming are melting of ice sheets and thawing permafrost. Furthermore, a study of 1 700 species found poleward migration of 40 km between 1975-2005 and vertical migration in alpine regions of 6 m per decade in the second half of the 20th century (Hansen and others 2006).
This graphic is part of the publication Keeping Track of Our Changing Environment.