Resource
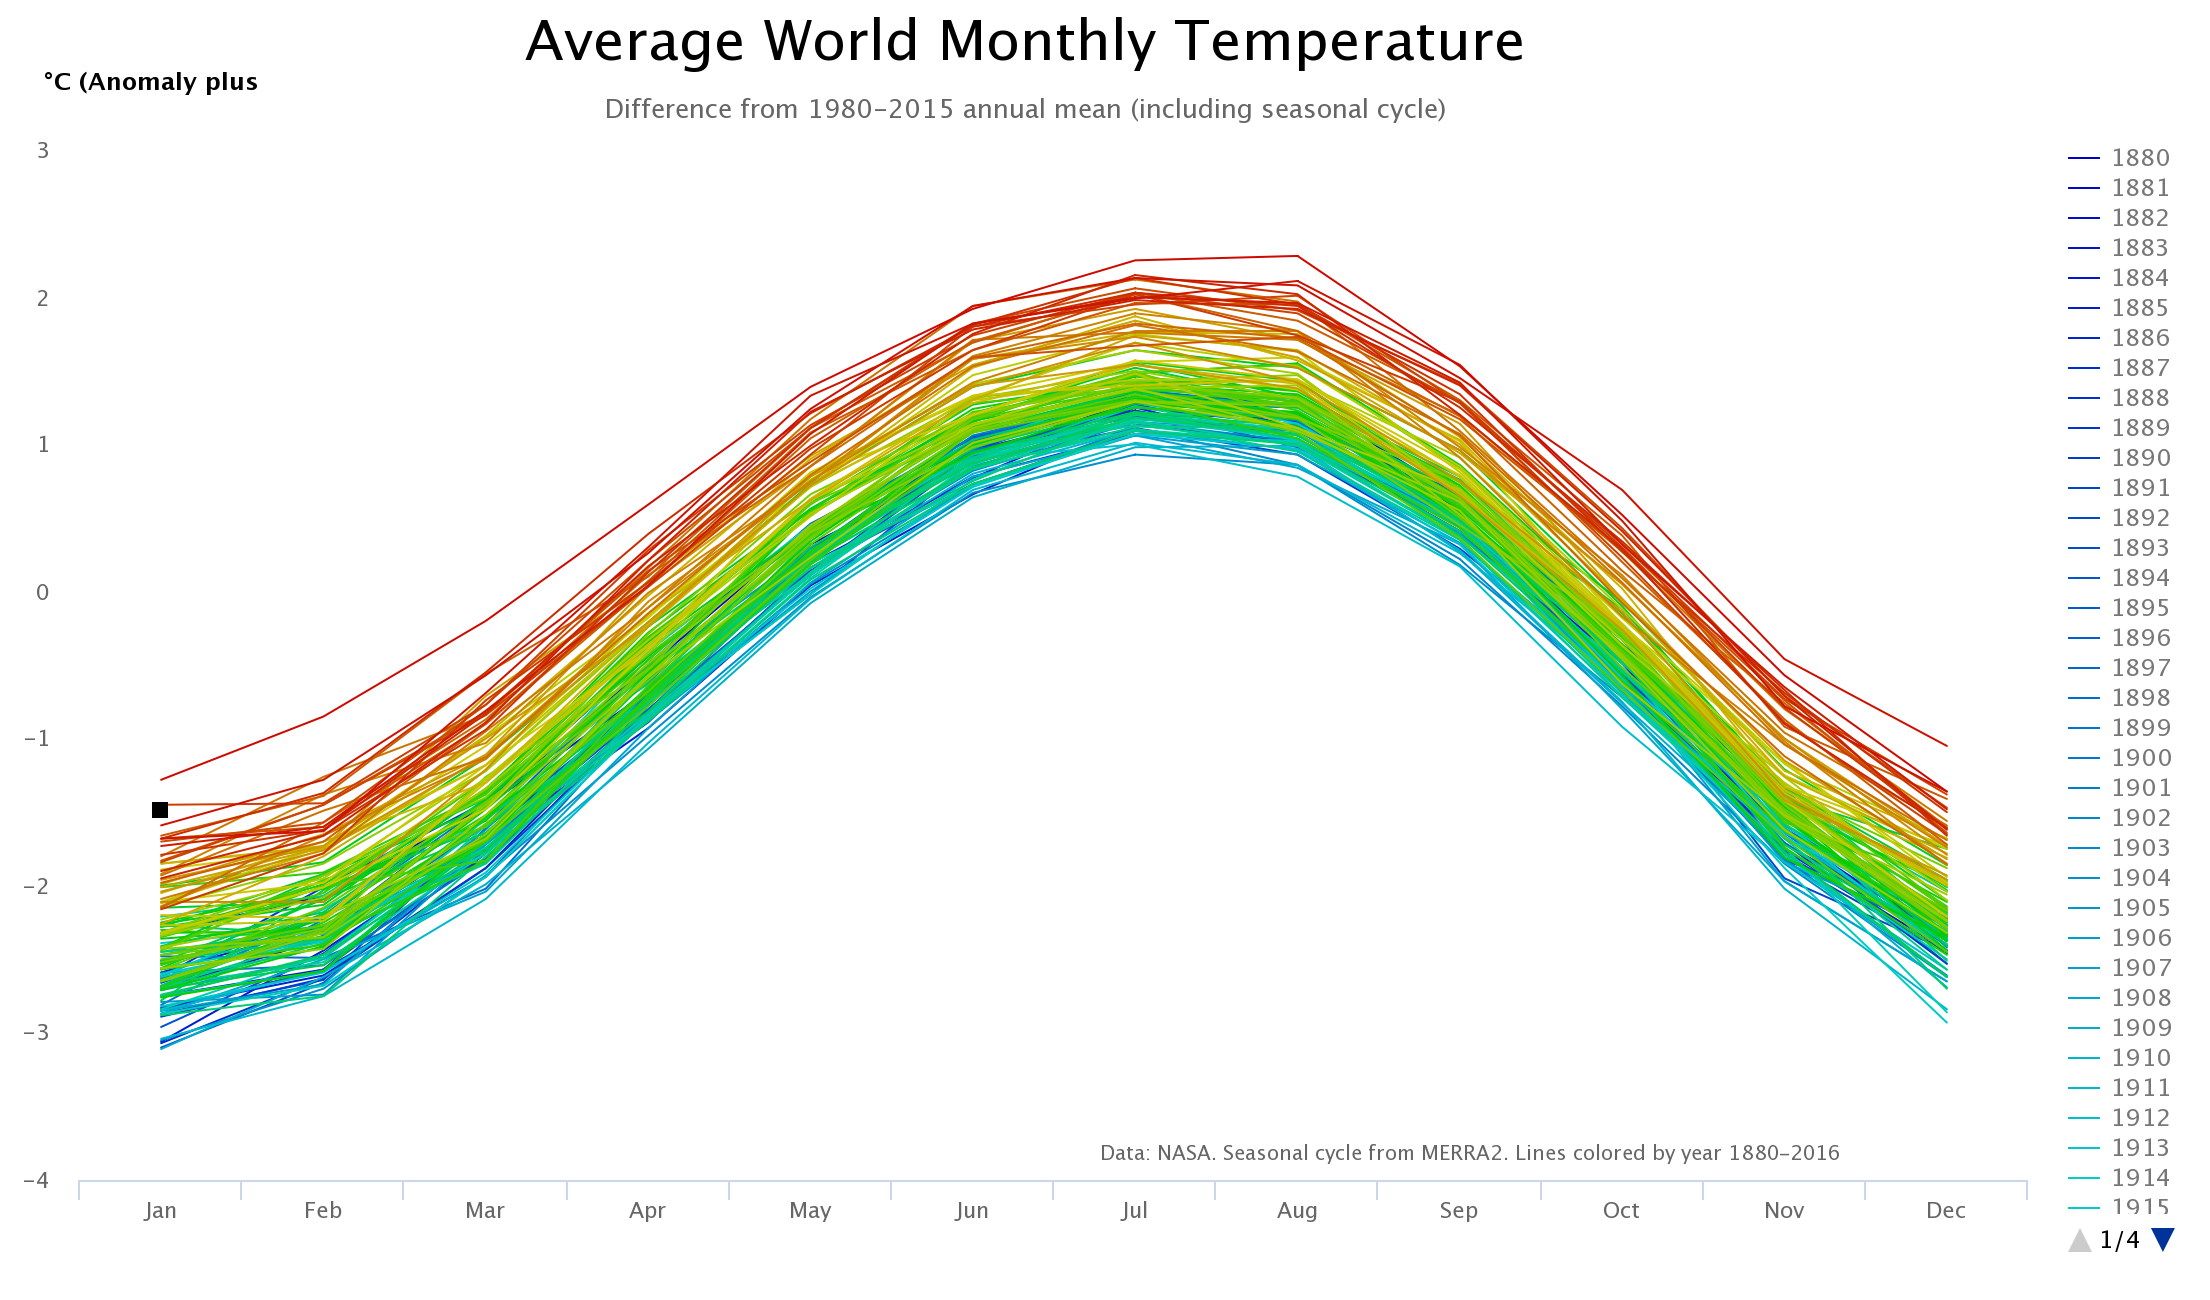
Average World Monthly Temperature
Description
This graph displays the seasonal and non-seasonal average monthly temperatures anomalies copared to the 1980-2015 annual means. The live graphic is available at: http://geodata.unepgrid.ch/extras/graph_global_temperature_monthly.php